

To really grasp the impact of the trade disruption in the Red Sea, we need to move from the big numbers to tea.

Lost Luggage Finders and Other Invisible labor
Looking closely at everyday activities, we would see the invisible labor that many of us rarely recognize.

When “Doing Good” Has Unintended Consequences
Although everything about multinationals implementing responsible sourcing sounds beneficial, a closer look reveals its complexities.
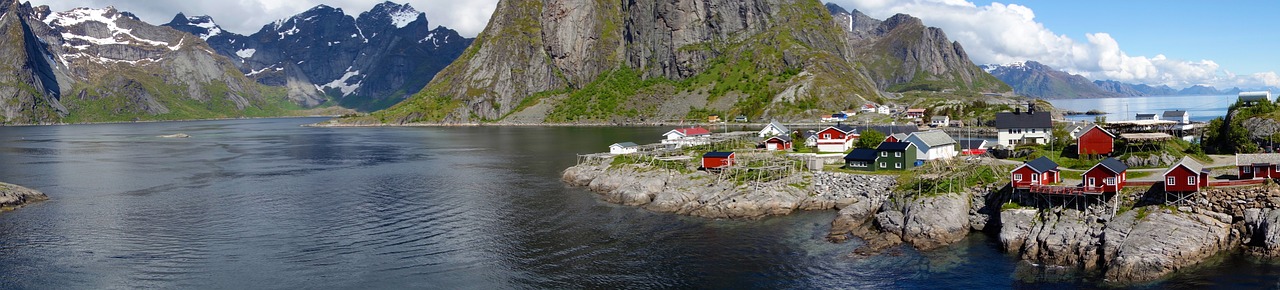
How Norway Got A Longer Coastline
Looking at the changing length of Norway’s coastline, we can ask if it is different or the change comes from us.

The Inventions That Really Made a Difference
Lighting history can remind us that a technology timeline reflects countless incremental steps as progress unfolds.

Why It’s Tough to Make an Office a Home
Solving the problem of empty office space, landlords have considered the challenges of converting vacant units to apartments.
What We Need to Know About Our Food’s Carbon Footprint
At Chipotle or Panera Bread, we might see the carbon footprint food labels that are starting to proliferate.

Why and How a Bee Will Get a Vaccine
With honeybee pollination so very crucial for U.S. agriculture, the significance of a new vaccine cannot be overstated.

Student Loan Debate Dilemmas
Misleading when we just look at $50,000 or $10,000, the student loan debate takes us to a long and complicated cost and benefit list.

What Japan’s Olympic Planners Never Bargained For
On the surface, rescheduling the Tokyo Olympics could sound manageable but looking at ticket refunds reveals the gargantuan costs.


-
1 
-
2 
-
3 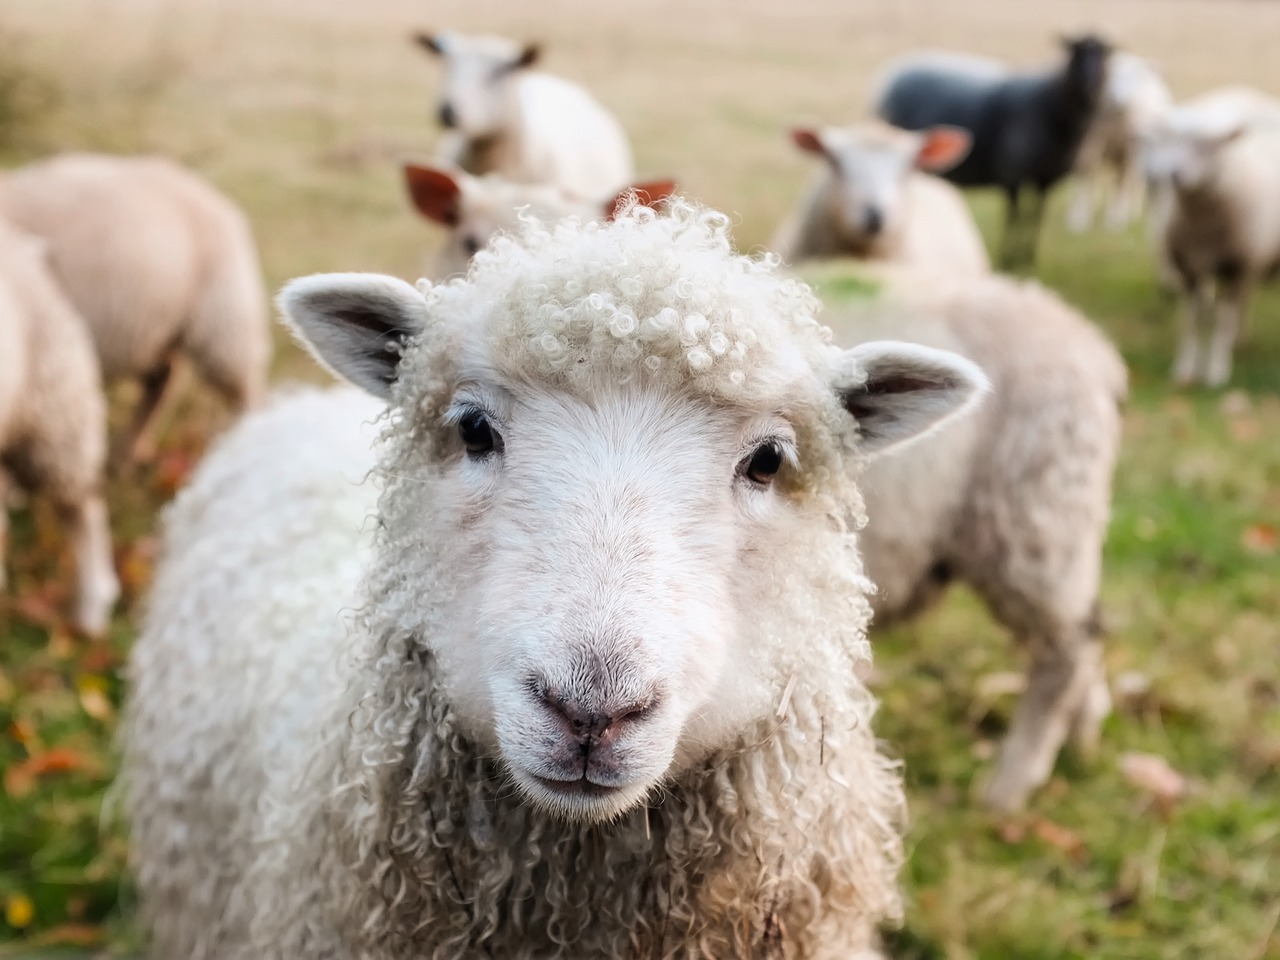
-
4 
-
5 


