![econlifelogotrademarkedwebsitelogo[1]](/wp-content/uploads/2024/05/econlifelogotrademarkedwebsitelogo1.png#100878)

October 1, 2025
Describing a shutdown with what, why, and when only begins to convey the complexities that affect millions of people in countless ways.
Describing a shutdown with what, why, and when only begins to convey the complexities that affect millions of people in countless ways.
Always a challenge, the U.S. deficit is a problem for the Congress because we will soon hit the debt ceiling again.
While a national deficit is normal, the recent reason for its projected growth has not been seen for decades.
Whether looking back to 1965's predictions or at the past decade, Medicare spending has alwaya had some surprises.
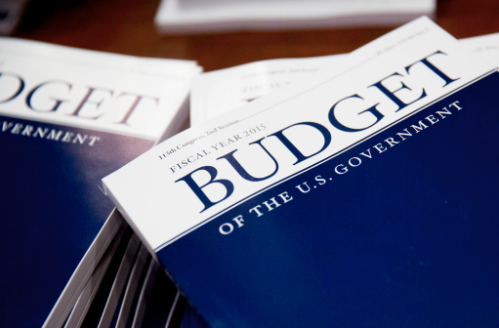
Published by the Concord Coalition, there is a timeline for the federal budget process. Already, the Senate Budget Committee missed its April 1st deadline: While […]
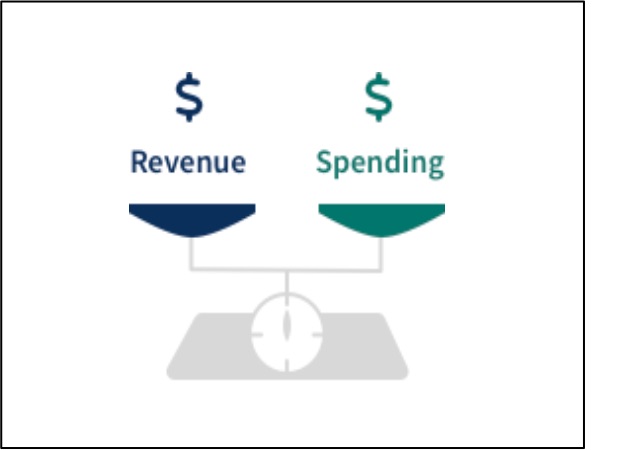
We can look at the federal budget to see why the debt ceiling should be raised before debating federal spending tradeoffs.
In the order for new presidential jets, President Biden changed the new colors that his predecessor had selected.
Behavioral economists explain that what we spend, how we eat, and even what the government spends for non-recurring events are similar.
Looking at the combination of luxury and defense, we can see why the new Air Force One presidential jets are an expensive purchase.
Through massive pandemic aid, the 2020 CARES Act ballooned the federal deficit. With spending far exceeding revenue, the difference was $2.8 trillion: Now, President-elect Biden […]
A looming Social Security shortfall could happen much sooner because of pandemic spending and its impact on the birth rate.
At $1 trillion, the ballooning U.S. deficit can be understood as a number, as a proportion of the budget, and the reason we owe China so much money.


