While the CBO’s (Congressional Budget Office) 2018-2028 report presents federal budget projections, the numbers also reflect the tradeoffs and some tough decisions.
Very long term federal debt that has no date for redemption like UK First World War bonds and U.S. Revolutionary War debt depend on good public credit.
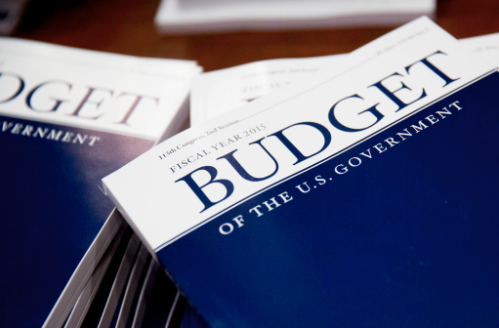
Right now, the Congress is supposedly debating the 2015 federal budget. Because the new fiscal year begins October 1, their deadline is September 30. But not really. 1996 was the last time the House and Senate punctually approved all necessary…
In the State-of-the-Union, President Obama said, “Our deficits–cut by more than half.” Looking at the federal deficit as a percent of GDP, we can say that the deficit is much lower than 4 years ago. BUT… The deficit was an unusually…
econlife®
Connecting economics with everyday life.
Located at the intersection of current events, history, and economics, econlife® slices away all of the layers that make economics boring and complex. We like economics and we would like for you to like it too.