![econlifelogotrademarkedwebsitelogo[1]](/wp-content/uploads/2024/05/econlifelogotrademarkedwebsitelogo1.png#100878)

February 28, 2025
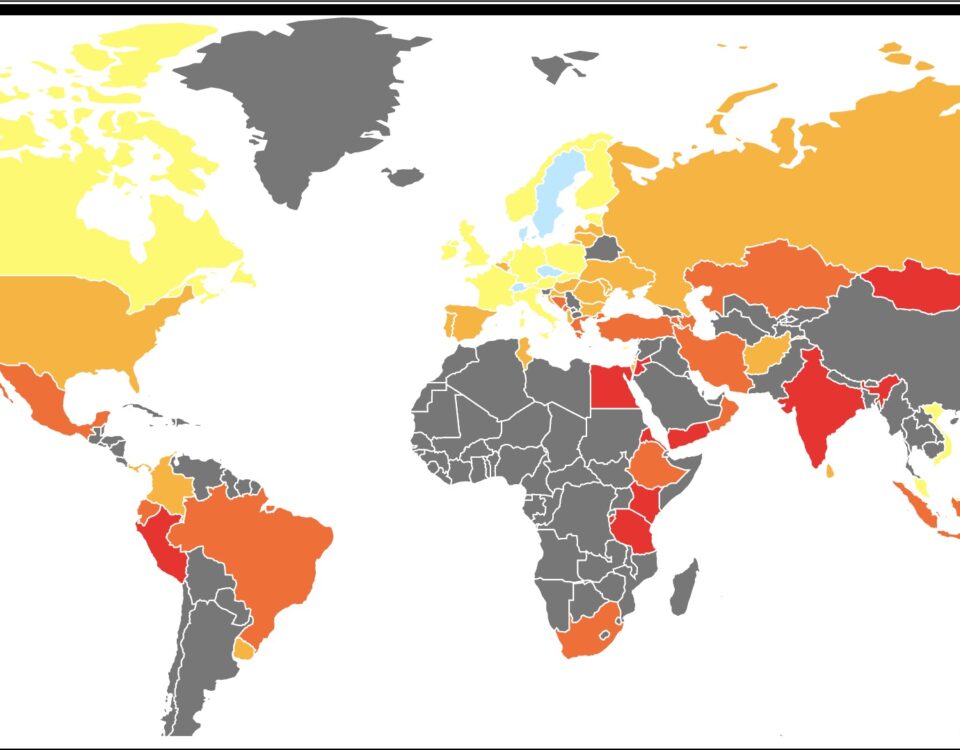
Comparing the Economist's Democracy Index and the Index of Economic Freedom, we wind up with some surprises about democracy and markets.
Comparing the Economist's Democracy Index and the Index of Economic Freedom, we wind up with some surprises about democracy and markets.
Looking at individual wealth from 1850 to 1940, we would observe a surprising number of people that dropped out of the top 1%.
Among the countless ways to measure global inequality, we can look between nations, within them, and over time.
Although the per capita GDP gap between two countries could appear large, the difference shrinks when you bring welfare into your calculations.
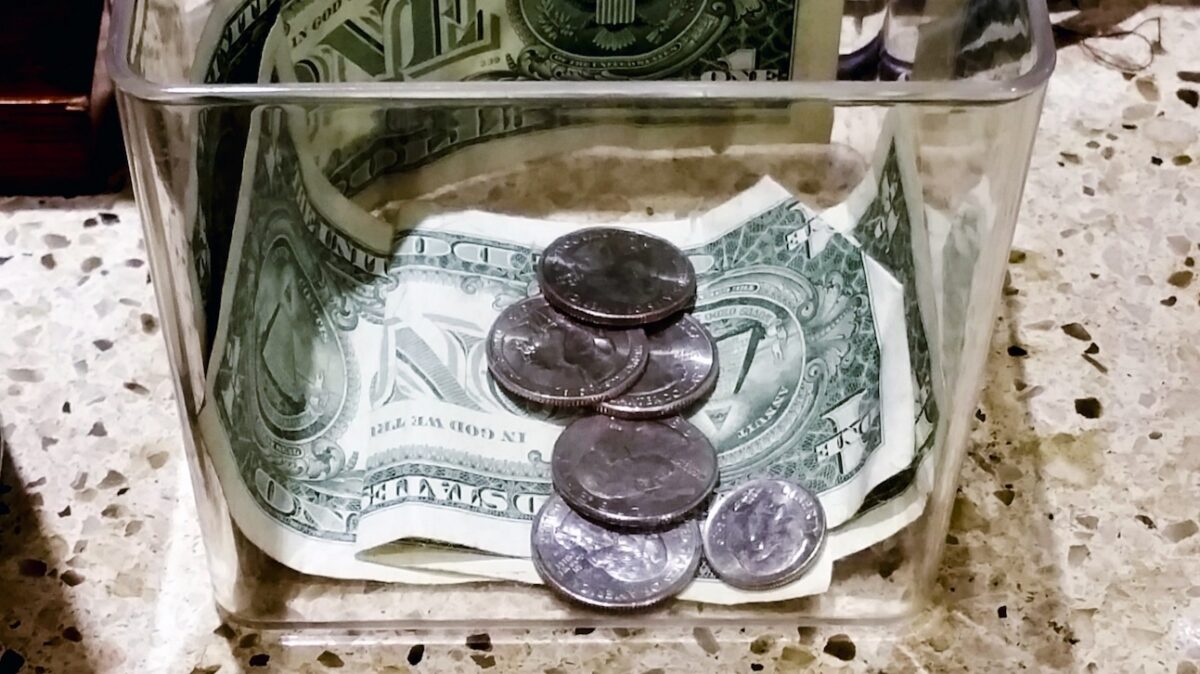
Disliked by many as discriminatory, inconvenient, and even embarrassing, tipping is a paradox because it refuses to disappear.
Barely recognized by U.S. News ranking, colleges where graduates achieve income mobility prove that the American Dream remains a viable goal.
This week's economic news summary includes the diner's dilemma and marginal analysis, property rights in outer space, the Phillip's Curve and unemployment.
With Brooklyn becoming a synonym for gentrification, we can call cities like Detroit a new Brooklyn when they attract artists and affect a poor population.
Posts Roundup Sunday 10.11.15 Why we stick with a brand…more Monday 10.12.15 The many meanings of the minimum wage…more Tuesday 10.13.15 How a drone port solves road […]
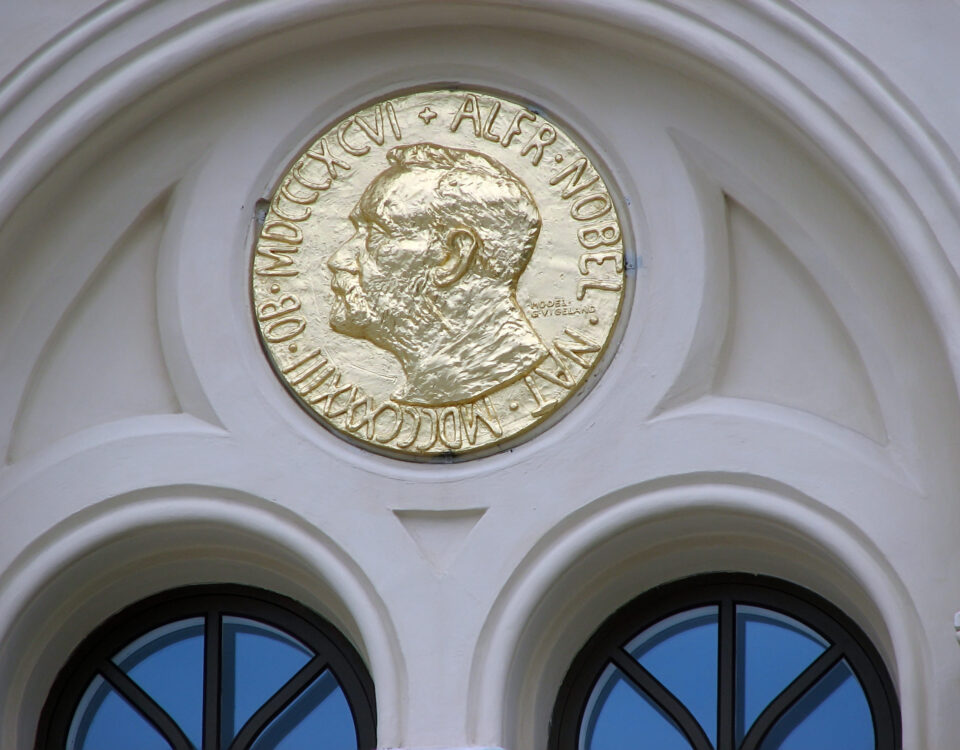
The 2015 winner of the Nobel Memorial Prize in Economics, Angus Deaton studied inequality through health and wealth and micro and macroeconomics.
Our economic news summary includes interest rates and the Fed, inequality and developing nations, space travel innovation and consumer spending changes.
Our economic news summary includes labor regulation and Uber, the GDP and streets, gasoline price fluctuation, food and inequality and markets and syrup.


