![econlifelogotrademarkedwebsitelogo[1]](/wp-content/uploads/2024/05/econlifelogotrademarkedwebsitelogo1.png#100878)

March 30, 2021

Looking at Covid and the Caribbean islands, we would see the massive impact of a tourism collapse on their economies.
Looking at Covid and the Caribbean islands, we would see the massive impact of a tourism collapse on their economies.
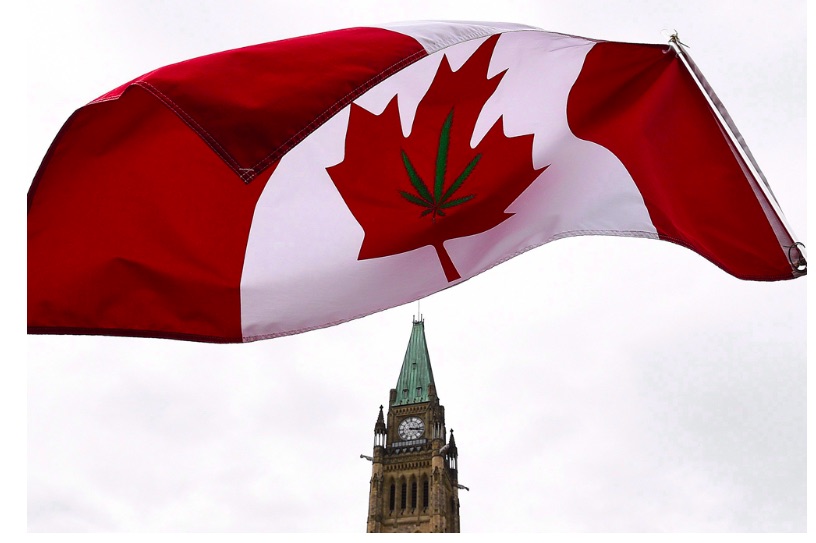
With marijuana legalization, Canada has had to revise 60 years of its Gross National Product (GDP) to avoid misleading numbers.
Estimating Santa's salary is a specific task that takes us to the broader issue of whether the GDP should include unpaid work.
Our everyday economics includes GDP, human capital, price system, public goods, taxes, gender pay gap, externalities, subsidies, marriage economics and ROI.
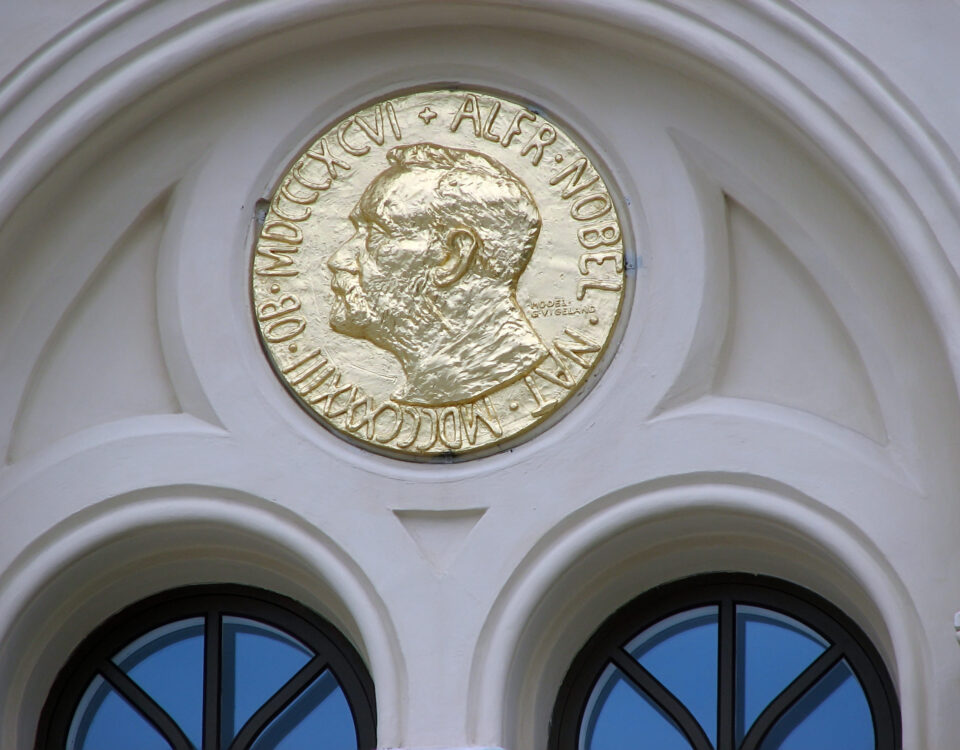
Shown by auctions of Nobel prize medals from recipients like Simon Kuznets and James Watson, through markets, the price system conveys information.
In 1987, Italy decided to include its “off-the-books” economy in its GDP. The result was an 18% boost. Now, further complying with EU accounting regulations, Italy […]


