

Looking at trendy food takes us to South Korean tastes and the U.S. history of new foods coming and going.

Why a Starbucks Macchiato Is Like a Model-T Ford
Whether looking at coffee or cars, at Macchiatos or Model-T’s, producers care about taking fewer steps in the cafe and the factory.

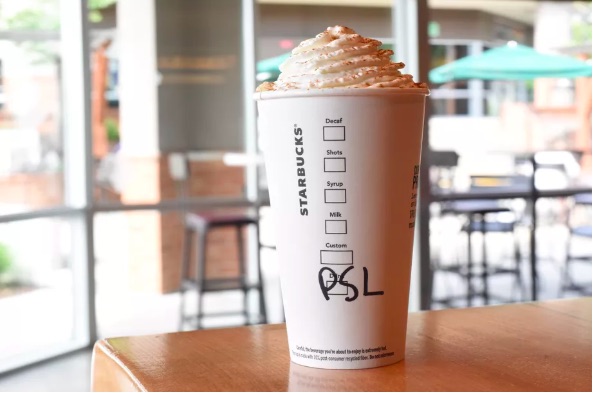
Why We Like the Pumpkin Spice Latte
Released at the end of August and available though the fall, the Starbucks Pumpkin Spice Latte is seasonal for a clever reason.

Why You Might Not Use Bitcoin at AMC
Spending bitcoin for your AMC movie theater ticket and a bucket of popcorn will be possible this year…but will you want to?

Why Starbucks Is Like Fortnite
Whether looking a Pumpkin Spice Latte from Starbucks or a LeBron James skin from Fortnite, we would see the impact of limited editions.

May 2020 Friday’s e-links: Business Wars and Disaster Tradeoffs
My May 2020 e-links include the “Business Wars” podcast series on competitors like Starbucks and Dunkin’ and a book rec on Katrina’s emergency tradeoffs.
The Surprising Reason That We Love Our Pumpkin Spice Lattes
An economist can explain the surprising reason that we eagerly anticipate the yearly launch of Pumpkin Spice Latte from Dunkin’ and Starbucks.

When Less Is More at Dunkin’ Donuts
When a firm like Dunkin’ Donuts does some rebranding with a name change, it is trying to send a new message to its customers

How a Behavioral Economist Explains a Frappuccino Problem
Since 1995, many of us have been consuming shamelessly decadent Frappuccinos. Just one Ultra Caramel Frappuccino with dark caramel coffee, layers of whipped cream (each topped with a dollop of caramel sauce), and white chocolate tops the 400 calorie threshold.…
Why We Want a Starbucks Pumpkin Spice Latte
The reason that we cannot resist limited edition drinks like a Starbucks Pumpkin Spice Latte is diminishing marginal utility.


