![econlifelogotrademarkedwebsitelogo[1]](/wp-content/uploads/2024/05/econlifelogotrademarkedwebsitelogo1.png#100878)

April 18, 2017
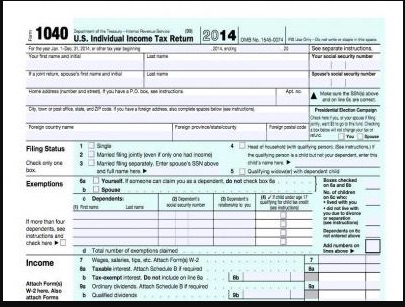
Asked about tax policy, most of us know little about who pays the most, how rates have changed, and which tax legislation was the best.
Asked about tax policy, most of us know little about who pays the most, how rates have changed, and which tax legislation was the best.